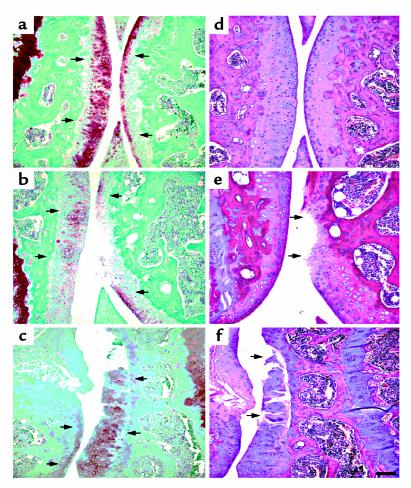
Figure 4.
Photomicrographs of the articular cartilage of the tibia (right) and femur (left), taken from 5-month-old mice removed from Dox at weaning (21 days). (a–c) Sagittal sections from a wild-type (a) and a heterozygous (b) line 6 and a coronal section from homozygous line 99 (c) stained with safranin O. (d–f) A serial section from each animal stained with H&E. The arrows in a, b, and c represent areas of safranin O staining, whereas the arrows in e and f point to focal lesions and degradation of the articular cartilage. Scale bar = 100 μm.

