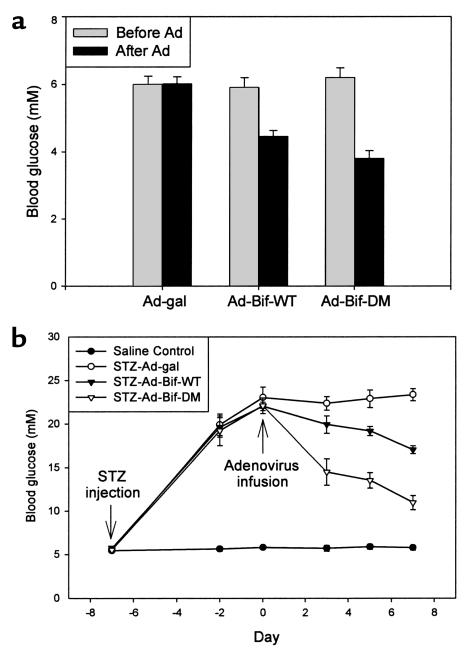
Figure 4.
Changes of blood glucose levels in normal and diabetic mice treated with adenovirus. (a) Normal mice were treated with adenovirus. Blood glucose was monitored on day 0 (before adenovirus infusion) and day 7 (after adenovirus infusion). The levels of blood glucose in both the Ad-Bif-WT and the Ad-Bif-DM groups decreased significantly (P < 0.01 versus before adenovirus infusion or Ad-gal group). Decreases in blood glucose levels in the Ad-Bif-DM group were much greater than those in the Ad-Bif-WT group (P < 0.05; n = 6). (b) Saline control and STZ-diabetic mice treated with adenovirus. All mice treated with STZ showed significant increase in levels of blood glucose on day –2 (P < 0.01 versus saline control group). After adenovirus infusion, blood glucose levels fell within 3 days (P < 0.01) in the STZ-Ad-Bif-DM group, and within 5 days (P < 0.01) in the STZ-Ad-Bif-WT group. By day 7, levels of blood glucose were decreased 50% in the STZ-Ad-Bif-DM group and 23% in the STZ-Ad-Bif-WT group. Decreases in blood glucose levels in the STZ-Ad-Bif-DM group were much greater than those in STZ-Ad-Bif-WT group (P < 0.01; n = 6).

