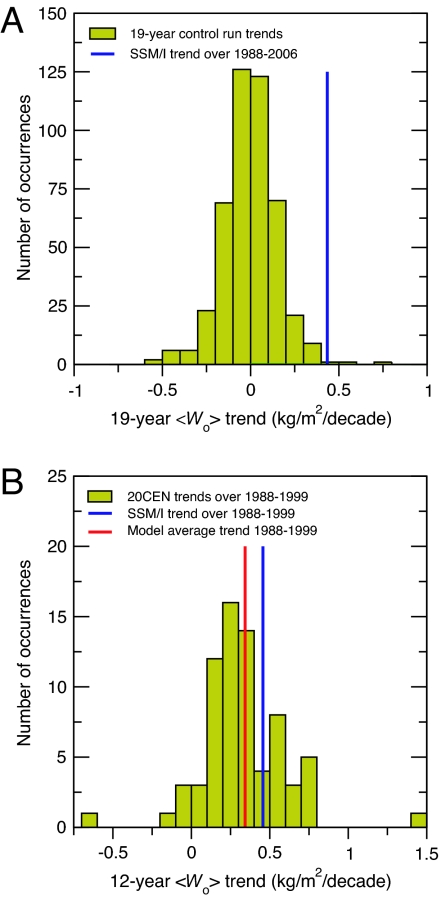
Fig. 2.
Comparison of observed 〈Wo〉 trends with model simulations of unforced (A) and externally forced (B) trends. The sampling distribution of unforced 19-year trends was calculated as described in the text. Residual control run drift was not subtracted before estimation of the trend sampling distribution, thus inflating the standard error of the distribution and making it more difficult to reject the null hypothesis that internal variability alone could explain the observed trend. Forced 〈Wo〉 trends over 1988–1999 were estimated from 71 realizations of the 20CEN experiment performed with 22 models (see SI Tables 2 and 3). The SSM/I trend over 1988–1999 is larger than the mean of the model distribution of forced trends, in part because of the effects of the large observed El Niño event in 1997/1998 (Fig. 1A), which is close to the end of the trend period used in B.

