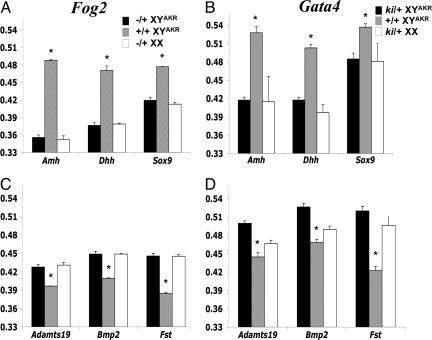
Fig. 4.
Expression pattern of fetal testicular-specific (A and B) and fetal ovarian-specific (C and D) genes in B6 Fog2 (A and C) and B6 Gata4 (B and D) homozygous normal and heterozygous mutant E14 gonads. Expression levels are relative to 18S rRNA expression. The mean values represent the average values of a minimum of three cDNA samples (one cDNA sample represents both gonads from one fetus). *, Significant (P < 0.05) higher (A and B) or lower (C and D) expression levels.

