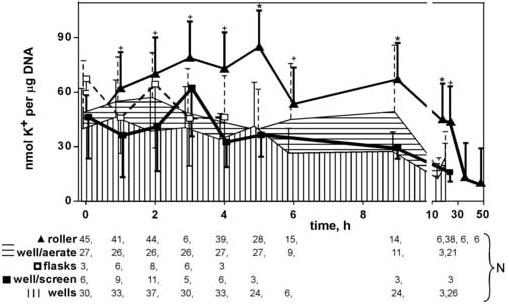
Figure 2.

Comparison of incubation methods to enhance viability of tissue chips. Each data point represents the average of N samples (given in legend below the chart), with error bars representing standard deviation (shown unidirectional for clarity). Note break in x-axis. Asterisks mark roller incubations that are statistically different from the best alternative method (P < 0.05 by Tukey’s multiple comparison test). Crosses mark roller incubations that were not statistically different from best of the alternatives, but were statistically different from the second-best alternative (P <0.05, Tukey’s).
