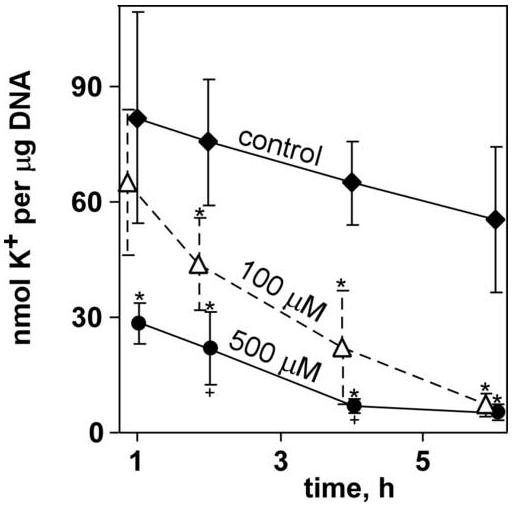
Figure 3.

Effect of selected dosages of IAM on tissue chips over time. Data points represent averages (N = 6 to 15 for each data point) with error bars representing standard deviation; an exception is the control 6-h timepoint, for which N = 60. Asterisks mark data points that were statistically different from control; crosses mark 500 μM treatments that were statistically different from 100 μM treatment (P < 0.05, Tukey’s).
