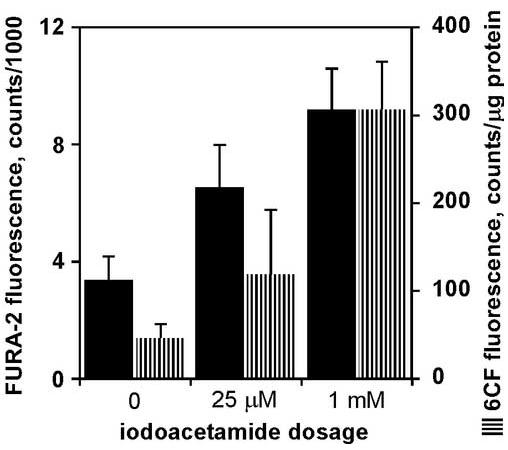
Figure 6.

Fluorescent probes to measure membrane integrity of tissue chips after 6-h incubations in varying concentrations of iodoacetamide. Each bar represents average of data from 7 − 12 tissue chips, with error bars as standard deviation. In both assays, all three dosages were statistically different from each other (P < 0.05, Tukey’s).
