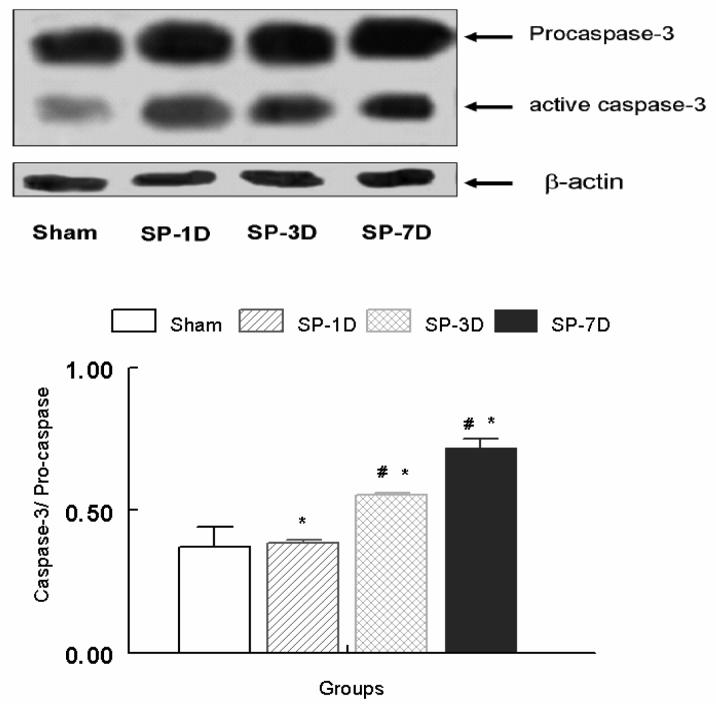
Figure 3.
Upper panel exhibits representative blot (from 5 experiments) for the expression of LV procaspase and active caspase-3 in sham, 1-, 3- and 7-days post sepsis groups. Alterations (fold change) in cytosolic active caspase-3/ procaspase ratio normalized to β-actin in sham, 1-, 3- and 7-days post sepsis groups. *p ≤ 0.05 as compared to the sham group, #p ≤ 0.05 as compared to the 1-day sepsis group.

