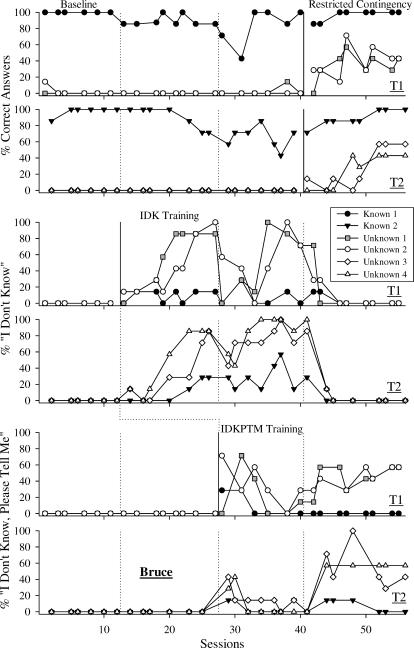
Figure 2.
Results for Bruce. Percentages of correct answers, IDK, and IDKPTM are depicted in the top two, middle two, and bottom two panels, respectively. Panels marked T1 and T2 show data from Teacher 1's and Teacher 2's sessions. Known questions are represented with filled symbols, the target set (Unknown Set 1) symbols are gray, and the untargeted sets (Unknown Sets 2, 3, and 4) are depicted with open symbols.

