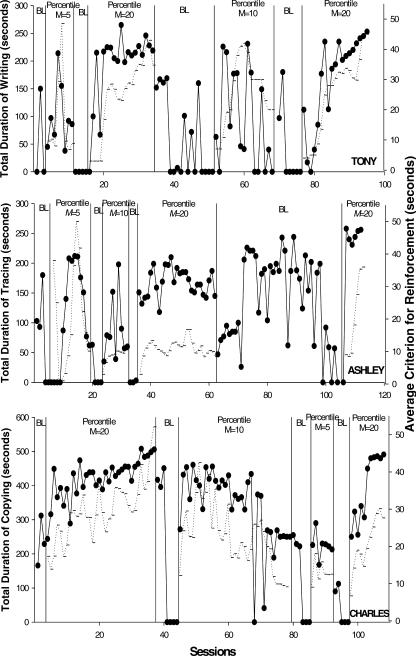
Figure 1.
Results for Tony, Ashley, and Charles. Filled circles indicate the total duration of on-task behavior, plotted in seconds along the left y axis. Horizontal marks connected by a dotted line represent the average criterion for reinforcement of a response, plotted in seconds along the right y axis.

