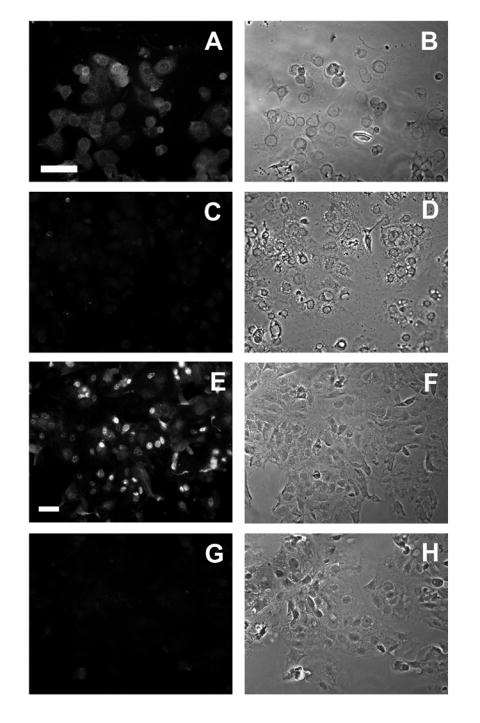
Fig. 1. Immunofluorescence detection of MUC1 in isolated macaque trophoblasts.

Trophoblast cells were cultured for 24 h then stained with CT2 (A) or B27.29 (E) anti-MUC1 antibodies and viewed by immunofluorescence microscopy (see Methods). The immunofluorescence images C and G show cells incubated with the corresponding control immunoglobulins. The images in the right-hand column are the respective matching phase contrast views. The horizontal bar represents 50 μm. The images are typical representatives from four separate experiments.
