Figure 1.


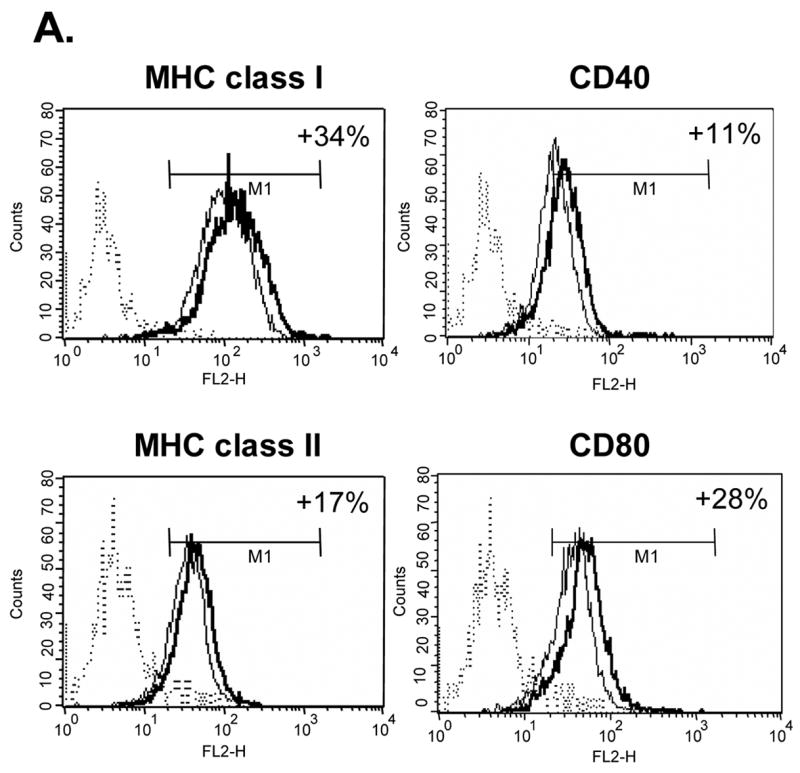
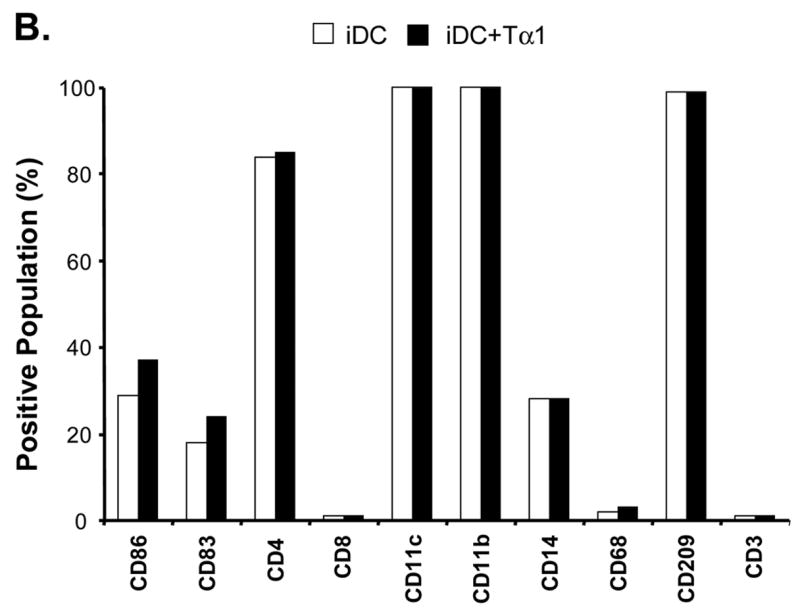
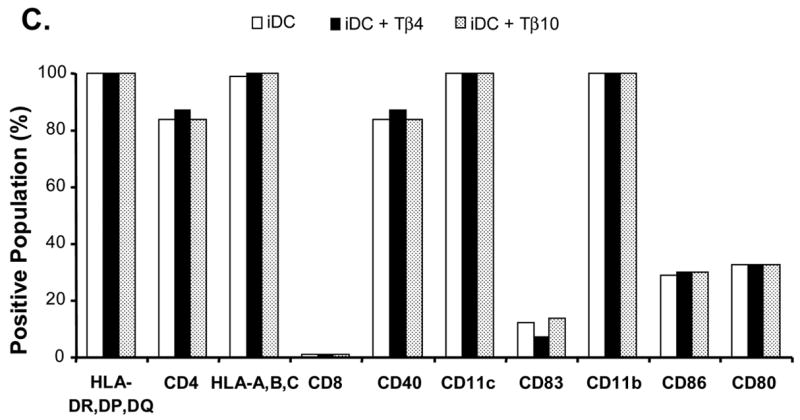
Effects of Tα1 on iDCs cell surface marker expression. CD14+ monocytes were induced to differentiate to iDCs in DC growth medium containing 500 U/mL rhGM-CSF and 500 U/mL rhIL-4 in the presence or absence of Tα1 (50 ng/mL), Tβ4 or Tβ10 (50 ng/mL) over the course of 5 days. Cell surface marker expression was stained for FACS analysis at day 5. iDC represents immature DC. IDC + Tα1 represents differentiation into immature DCs in the presence of Tα1 treatment. Data were statistically analyzed with student t-test. Data represented in this figure are representative of one from more than three experiments with DC preparations from different donors. (A) FACS histograms representing in percentages of changes in mean fluorescence intensity (MFI), relative to untreated controls, the elevated expression of cell surface markers MHC class I, MHC class II, CD40 and CD80 expression in the presence of Tα1 during DC differentiation. Dotted lines represent isotype controls. Solid lines represent untreated-controls. Bold lines represent Tα1-treated iDCs. Percentage values as denoted represent positive change of mean fluorescence intensity (MFI) after Tα1 treatment. Statistical t-test values for each marker are p < 0.01. (B) iDC surface markers that are not affected by Tα1 treatment. Y-axis represents percentage of marker staining positive cells. X-axis shows different markers determined. Data were statistically analyzed with student t-test values p > 0.05. (C) Beta- thymosin treatment does not affect iDCs surface markers expression. iDC + Tβ4 represents differentiation into immature DCs in the presence of Tβ4 treatment. iDC + Tβ10 represents differentiation into immature DCs in the presence of Tβ10 treatment. Y-axis represents percentage of marker staining positive cells. X-axis shows different markers determined. Data were statistically analyzed with student t-test values p > 0.05.
