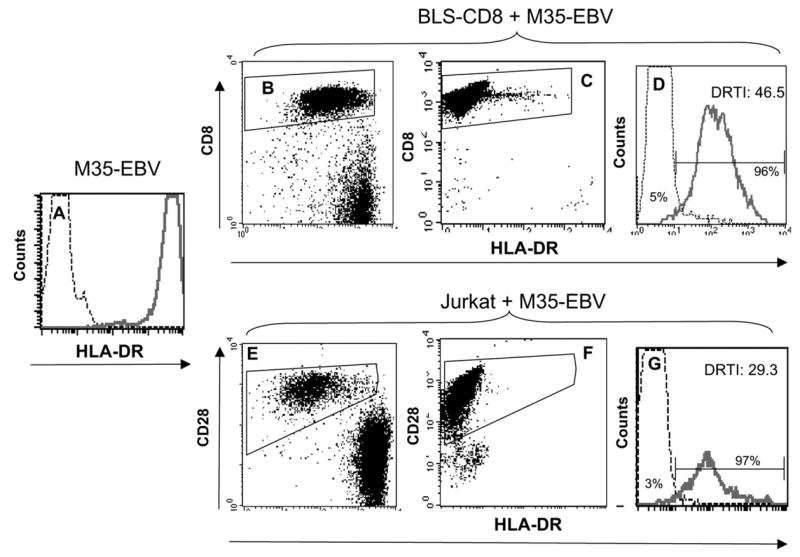
Fig. 1.

Transfer of MHC class II from APC to T cells. M35-EBV cells, which express high levels of HLA-DR, were used as APC. (A) Solid line corresponds to the staining of M35-EBV cells obtained with anti-HLA-DR antibody and the thin line represents the antibody isotype control. BLS-CD8 T cells (B–D) or CD28+ Jurkat T cells (E–G) were incubated with (or without) M35-EBV cells at 1:1 ratio for 3 h and HLA-DR expression on the gated Tcell populations was examined by flow cytometry. Dot plots in (B) and (E) correspond to cultures containing Tcells and APC, while dot plots in (C) and (F) are the cultures containing T cells alone. The data presented in the histograms (D) and (G) correspond to the cell populations gated on CD8+ T cells (B and C) or CD28+ Jurkat cells (E and F). Thin lines in the histograms (D) and (G) represent HLA-DR staining of BLS-CD8 T cells and Jurkat cells not incubated with M35-EBV (data gated from C and F). Solid lines in the histograms (D) and (G) correspond to the data gated on panels (B) and (E). The ‘DR transfer index’ (DRTI) was calculated by dividing the MFI of HLA-DR staining of the cells incubated with APC over the MFI of HLA-DR staining the control T cells (not incubated with APC). The percentage of HLA-DR+ cells for each population is shown for each histogram curve, calculated using the gates established with isotype controls. These results are representative of three independent experiments.
