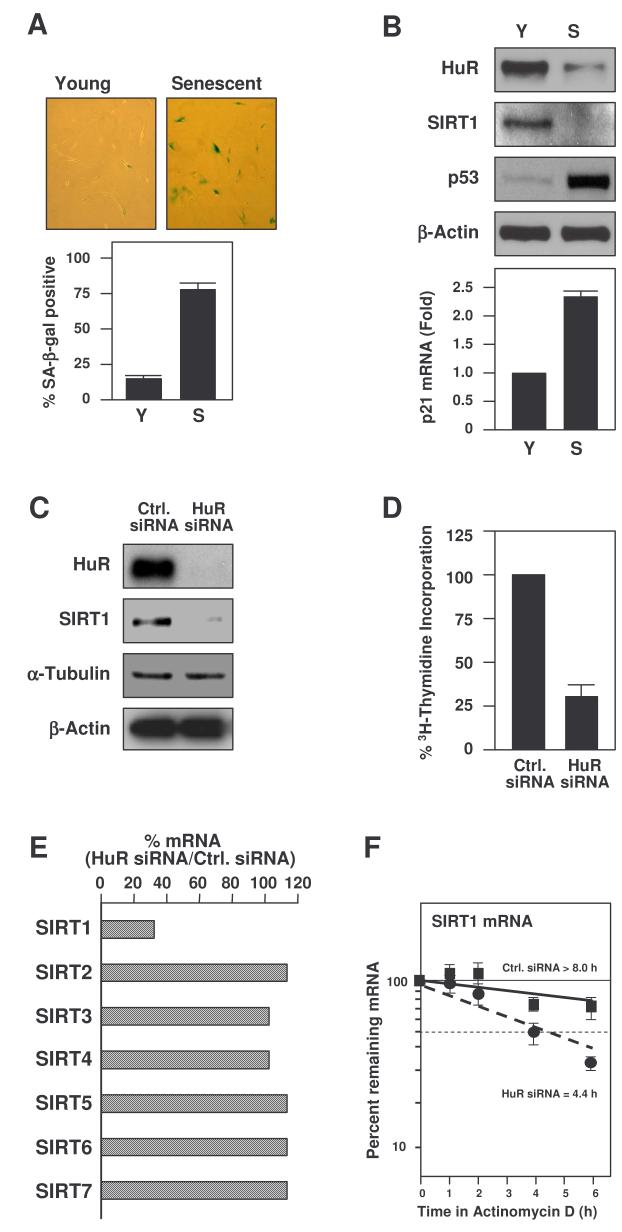
Figure 3. Reduced SIRT1 levels in senescent or HuR-silenced HDFs.
(A) SA-β-galactosidase activity in proliferating (Young or Y) and Senescent (S) WI-38 HDFs, at 28 and 52 population doublings, respectively. Graph, percentages of SA-β-galactosidase-positive cells. (B) Western blot analysis to monitor the expression of HuR and SIRT1 in Y and S HDFs. p53 and β-Actin levels were tested as positive and loading controls, respectively; p21 mRNA levels were measured by RT-qPCR (graph). HDFs were transfected with the siRNAs indicated and collected for analysis 5 d later. The effect of HuR silencing on HDF protein expression was assessed by Western blotting (C) and its influence on proliferation by measuring 3H-Thymidine incorporation (D). (E) Effect of HuR silencing on the levels of SIRT1-7 mRNAs in HDFs as determined by RT-qPCR in two separate experiments (mean values shown). (F) Half-lives of SIRT1 and GAPDH mRNAs in HDFs. Total RNA was extracted, SIRT1 and GAPDH mRNA levels monitored by RT-qPCR, normalized to 18S rRNA levels, and the half-lives calculated as described in the legend of Fig. 2E. Data represent the means ±SEM from 3 independent experiments.

