Fig. 5.

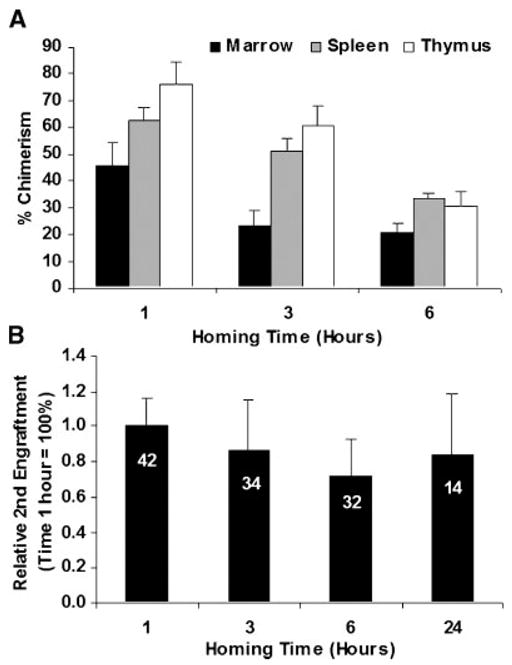
Secondary engraftment of bone marrow at different times after initial allogeneic homing. A: The percentage of chimerism at 8-weeks in bone marrow, spleen, and thymus by FACS staining for CD45.1 and CD45.2 is presented. The data was corrected according to the relative enrichment ratio observed after 10-Gy lethal irradiation. Mean and SEM is shown, there were respectively 13, 10, and 13 mice for each time point. The difference between 1 and 6 h were significantin all organs (P = 0.043, <0.001, and 0.001 for bone marrow, spleen, and thymus, respectively). A test for trend from 1 to 6 h was significant for spleen and thymus (P < 0.005). B: Serial analysis of the percent of relative secondary engraftment in three pooled experiments compared with 1 h homing values. Data were corrected for cellularity decay and normalized based on the average marrow chimerism of each experiment. This data shows that homing and the subsequent engraftment chimerism percent plateaus within 1 h. There was decreased homing and engraftment with marrow collected 6 h after primary homing before retrieval and secondary homing and engraftment. The difference between 1 and 6 h was significant (P = 0.017). A test for trend from 1 to 6 h was significant (P = 0.01). The number of animals in each time-point is seen in white on each data bar. The Kruskal–Wallis test was performed to compare all groups.
