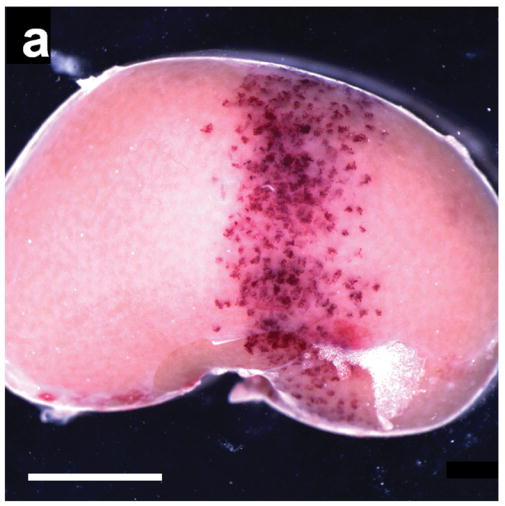
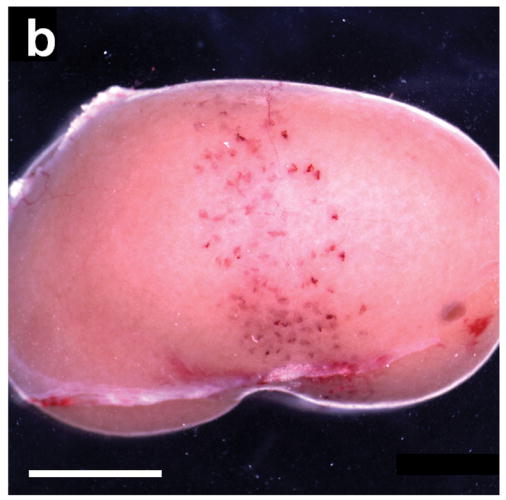
Figure 1.


(a) A typical example of a kidney removed 5 min after being scanned at an equivalent MI of 1.5 with 60 images triggered at 1 s intervals during injection of 10 μl/kg/min of contrast agent from Miller et al. (2007). The 4.6 mm wide scan plane generated by the stationary transducer is evident from the band of blood-filled tubules, which are normally filled with clear glomerular filtrate: scale bar 5 mm. (b) A kidney scanned under the same conditions as in a), but not removed until 24 hr after scanning from this study. Some nephrons have apparently cleared the blood from their tubules whereas others remained filled with blood: scale bar 5 mm.
