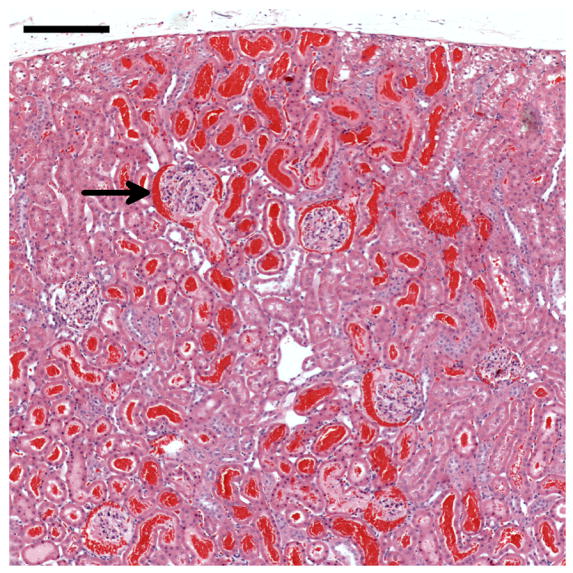
Figure 2.

Histology of a kidney removed 5 min after contrast ultrasound at MI=1.5. Most of the glomeruli in the field of view have blood in Bowman’s space (one example indicated by the arrow) and many tubules are filled with blood. The blood-filled tubules near the surface (top) represent the red markings seen grossly on the freshly excised kidneys (Fig. 1a): scale bar 0.2 mm.
