
Figure 2.
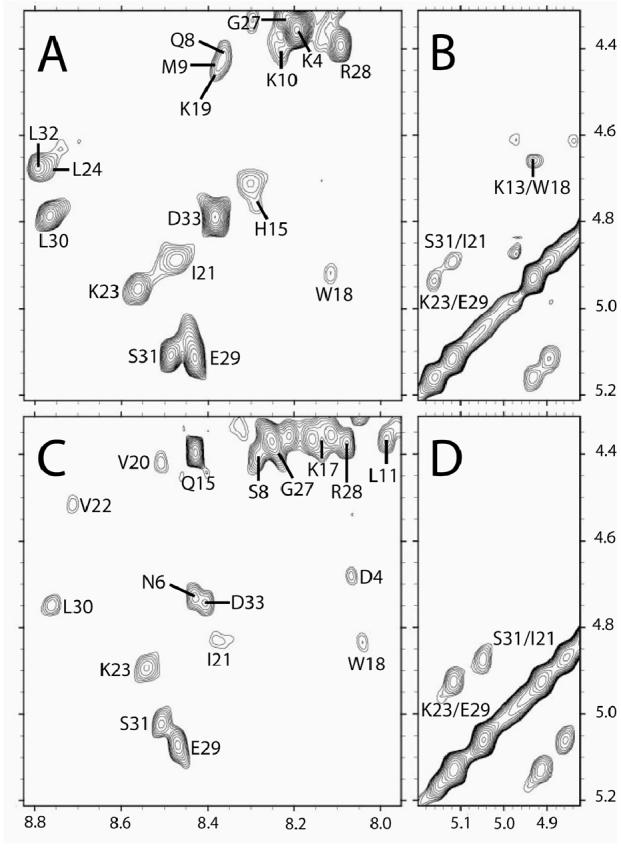
TOCSY and NOESY spectra for anginex and βpep-28. 600 MHz 1H 60 ms TOCSY and 200 ms NOESY spectra are shown for anginex (A, B) and βpep-28 (C, D). Peptide concentration was 1.0 mM in H2O/DMSO (1:1) and 50 mM DPC, pH 5.5 and 40 °C. Spectra were accumulated with 4 k data points over 9000 Hz sweep width and were processed with 1 Hz line broadening. Only spectral regions downfield from the HDO resonance are shown and some key NOEs are identified. Several cross-peaks have been labeled. Some cross-strand αH-αH NOEs used to indicate β-strand alignment are also indicated.