
Figure 1. OP differentiation into oligodendrocytes.
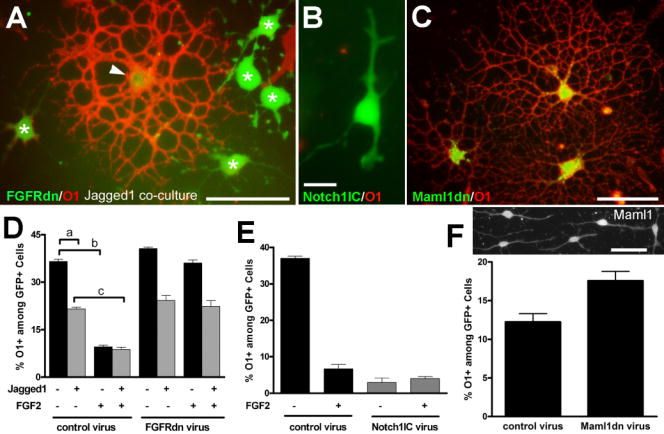
OP cells were infected with retroviral constructs to modulate receptor and ligand elements of the FGF2 and notch signaling pathways. OP differentiation into oligodendrocytes was monitored by O1 immunostaining. A: OP cells infected with retrovirus expressing a dominant negative form of fibroblast growth factor receptor (FGFRdn) and green fluorescent protein reporter (GFP; green). After 3 days of co-culture with Jagged 1 expressing fibroblast cells (not fluorescently labeled) many of the retrovirally labeled cells have immature characteristics (green; asterisks) in contrast to the differentiated oligodendrocyte (arrowhead) with highly branched processes and immunolabeling for O1 (red). Scale bar = 50 μm. B: OP cell infected with retrovirus expressing the intracellular domain of Notch 1 (Notch1IC), a constitutively active form, and GFP (B, green) has an immature morphology and lacks O1 immunoreactivity (red absent). Scale bar = 15 μm. C: OP cells infected with a retrovirus expressing a dominant negative form of mastermind-like1 (Maml1dn), a co-activator of notch target genes, and GFP (green) exhibit elaborate processes and O1 immunoreactivity (red), indicative of differentiation into mature oligodendrocytes. Scale bar = 50 μm. D, E, F: Quantitation of the proportion of O1 immunolabeled cells among retrovirally infected cells identified by expression of the GFP reporter. D: OP cells infected with retrovirus and then co-cultured with a fibroblast line expressing Jagged1 (+) or the parental L cell line (−). Cells were grown in defined medium with (+) or without (−) FGF2. Co-culture of OP cells with fibroblasts expressing Jagged1 decreased the proportion of OP cells that developed O1 immunoreactivity (a; p < 0.01). FGF2 severely reduced O1 acquisition (b; p < 0.001), which was abrogated by FGFRdn transduction. FGF2 further decreased O1 acquisition as compared to co-culture with Jagged1 expressing cells (c; p < 0.001). E: Notch1IC transduction strongly inhibited OP differentiation (p<0.001), compared with control retrovirus, and was not further reduced with FGF2 treatment. F: Upper panel shows immunostaining for endogenous Maml1 expression in OP cells. Scale bar = 50 μm. Lower panel shows that FGF2 inhibition of OP differentiation was significantly perturbed by Maml1dn transduction (p < 0.05 vs control virus). Values (mean ± standard error of the proportion) are from three independent experiments with at least 300 GFP+ cells counted for each condition.