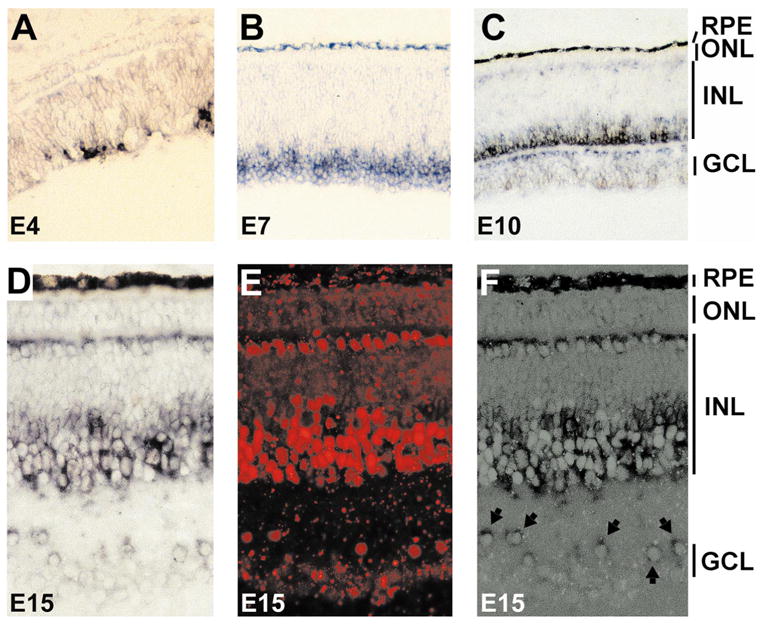
Figure 2.

Spatial-temporal pattern of cNSCL2 expression in the developing retina. (A–C) Cryosections of chick retinas at E4 (A), E7 (B), and E10 (C) hybridized with digoxigenin-labeled antisense RNA probes against cNSCL2. (D–F) Double labeling of E15 retina with anti-cNSCL2 RNA probes and anti-AP2 antibodies. (D) View of cNSCL2 mRNA-positive cells; (E) view of AP2+ cells with epifluorescence; (F) simultaneous view of both cNSCL2 mRNA+ cells and AP2+ cells demonstrates a colocalization of the two markers. Arrows: double-labeled, displaced amacrine cells (F). Magnification, (A–C) ×50; (D–F) × 100.
