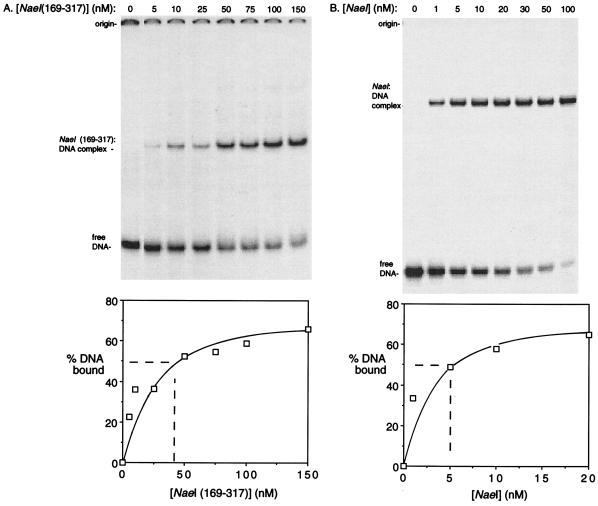
Figure 3.
Determination of apparent KD for NaeI and NaeI(169–317) binding to DNA using gel mobility-shift assay. DNA probe was cognate 36-mer double-stranded DNA (0.2 nM). The protein concentrations used in each reaction are shown above each lane. The reaction conditions are described in Materials and Methods. The band intensities as a function of protein concentration were quantitated by densitometry and are plotted in the graphs at the bottom.

