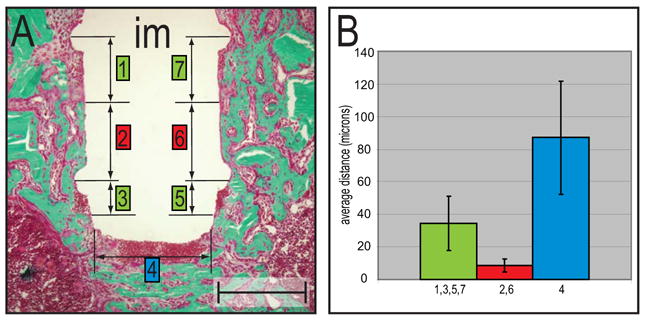
Figure 7.

Histomorphometry of bone matrix deposition at various implant locations.
(A) The tissue-implant interface (Goldner’s trichrome) was divided into seven locations that represented areas of low (2,6) or high (1,7,3,4,5) effective strain fields. (B) The graph shows a difference in the distance between implant surface and bone matrix deposition in three areas. The areas of high effective strains (e.g., base of implant, tissue underneath circumferential ridges) revealed the greatest distance, while the area in between the ridges, which was subjected to moderate strains, showed bone formation in close proximity to the implant. Error bars show mean and standard deviations. Abbreviations: im: implant. Scale bar: 300 μm.
