
Figure 3.
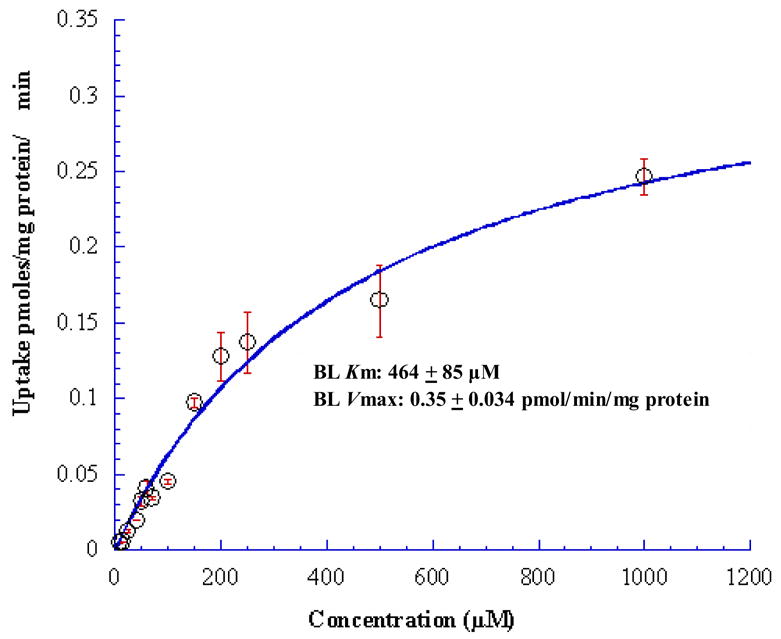
Concentration dependent BL uptake of [3H] Gly-Sar across MDCKII-MDR1 cells. Solid line represents the calculated fit of the data to Michaelis-Menten eq. as described under Materials and Methods. Each data point represents the mean ± S.D. of 4–5 separate uptake determinations