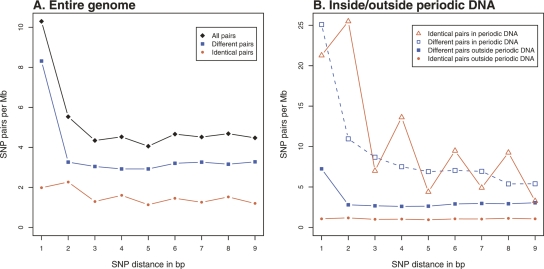
Figure 2.
Density spectrum of SNP pairs. (A) SNP pairs from the entire genome. The 2, 4, 6, 8 pattern is visible in all SNP pairs, and caused by the variation in identical pairs. Pairs of different SNPs are almost uniformly distributed for d > 1. Red represents identical pairs of SNPs and blue represents pairs of different SNPs. (B) SNP pairs inside and outside periodic DNA. The 2, 4, 6, 8 pattern is strongest in periodic DNA and nearly disappears outside periodic DNA. Also, there is a strong general over-representation of SNP pairs in periodic DNA when compared to the rest of the genome.

