
Fig. 6.
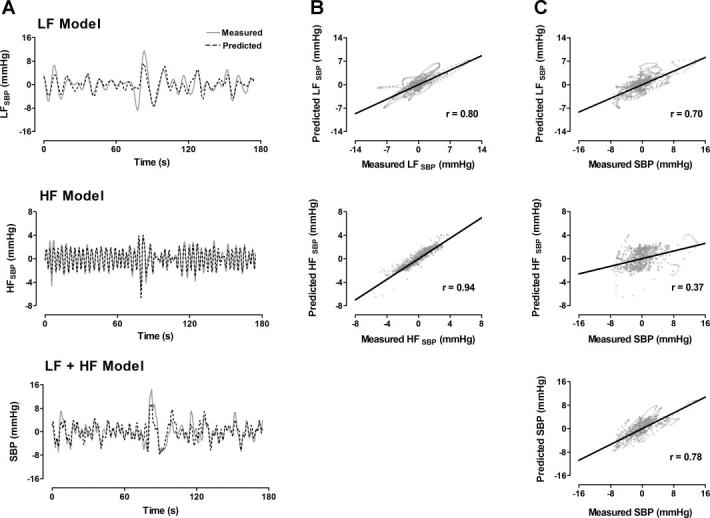
A: measured and model-predicted time series for LF component (top), HF component (middle), and total (LF + HF, bottom) detrended SBP. B: correlations between measured and predicted LF and HF time series in A. C: correlations between predicted time series in A and measured total SBP. LFspike rate and HFResp were used as LF and HF model inputs, respectively (see Fig. 2).