
Figure 1. Expression of CtBP1 in sensitive and MDR cancer cells.
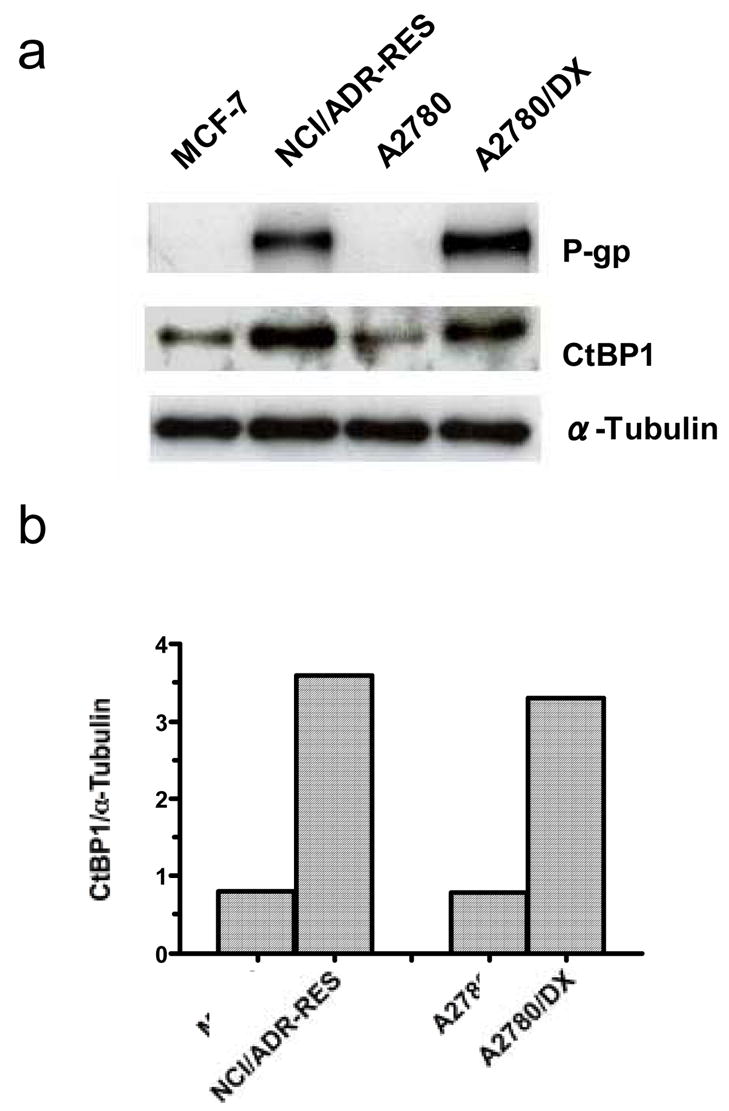
a. Cell lysates were prepared from sensitive and MDR cancer cells using RIPA buffer, and equal amounts (50 μg) of proteins were resolved by 6% SDS-PAGE. Proteins were transferred to nitrocellulose membrane, and CtBP1 and P-gp were detected by immunoblotting with monoclonal anti-CtBP1 or anti-P-gp antibodies, respectively. α–tubulin was used as a loading control. b. CtBP1 protein expression in sensitive and MDR cells was quantified by densitometry using Scion Image software (Scion Corporation, Frederick, Maryland). Results are the representative of three similar experiments.