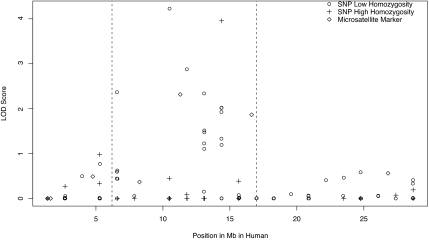
Fig. 1.
Mapping of the HVA QTL. lod scores for SNP and STR markers in the putative QTL region on vervet 9p are shown. On the horizontal axis is the position of the marker, in megabases, taken from the human physical map, and on the vertical axis is the lod score for the test of the null hypothesis that a QTL is at a given position. SNPs with low observed homozygosity (<75% of vervets homozygous) are indicated with open circles, SNPs with high observed homozygosity (>75% of vervets homozygous) are plotted with crosses, and STRs are plotted with solid squares. In the region between ≈7.5 and ≈17.5 Mb (dashed lines), where the highest lod scores are found, low lod scores were found primarily for uninformative SNPs with high homozygosity. Regions with no significant linkage signal contained both informative and noninformative markers, indicating that the lack of a linkage signal in these regions was not likely because of a lack of informative markers.

