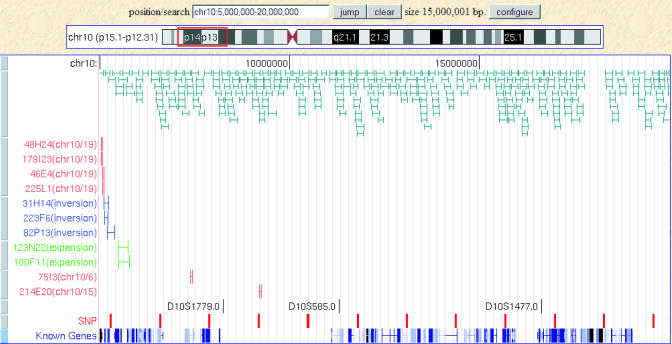
Fig. 2.
Vervet and human genome collinearity. The 15-Mb human region (hg18 chr10:5,000,000–20,000,000) encompassing to the area of highest lod scores (orange box) is shown on the University of California, Santa Cruz, browser (http://genome.ucsc.edu). A series of custom tracks displaying vervet BAC end sequence alignments and inferred BAC clone orthologous relationships are also shown. A total of 315 BAC clones displaying appropriate end sequence orientations and distances are presented in green, collectively covering 93% of the interval. A series of BAC clones with noncolinear end sequence alignment results are also shown: four clones (in red) with one end aligning to human chromosome 10 and the other to human chromosome 19 (in red); three clones with both ends aligning to human chromosome 10 on the same DNA strand (in blue); two clones with inferred sizes more than three standard deviations of the average clone size (in green); and two clones (in red) with one end aligning to human chromosome 10 and the other to a different human chromosome. Vervet-mapping STRs are presented in black, and the positions of SNP clusters are shown in red. Known genes are shown in a dense format, highlighting the scarcity of known genes in the D10S1779–D10S585 interval within the area of significant linkage.

