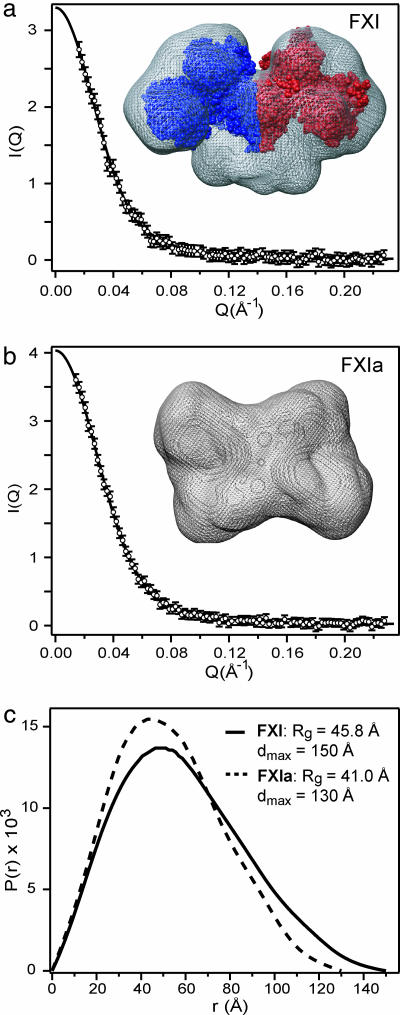
Fig. 3.
Conformational changes associated with activation of FXI monitored by SAXS. (a and b) The scattering intensity, I(Q), is plotted vs. scattering vector, Q, for FXI (a) and FXIa (b). (c) The lines represent the predicted scattering profiles corresponding to the P(r) functions. Low-resolution structures derived from the SAXS profiles by ab initio simulated annealing calculations (25) for FXI and FXIa are shown in a and b, respectively, using mesh surface rendering. For comparison, a space-filling representation of FXI based on the crystal structure (7) is included in a.

