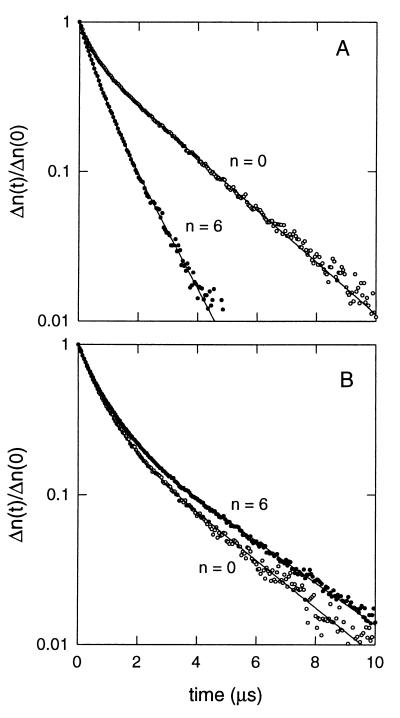
Figure 4.
Representative birefringence decay curves for two E[tRNAPhe:A5] species, n was as indicated. (A) Presence of 2 mM Mg2+. (B) Absence of magnesium ions. Solid lines represent double-exponential fits to the experimental data by using the Levenberg–Marquardt method (23); terminal (slower) decay times were used for the τ ratio analysis. Buffers are as specified in the legend to Fig. 3, except for the sodium phosphate concentration, which was 5 mM.

