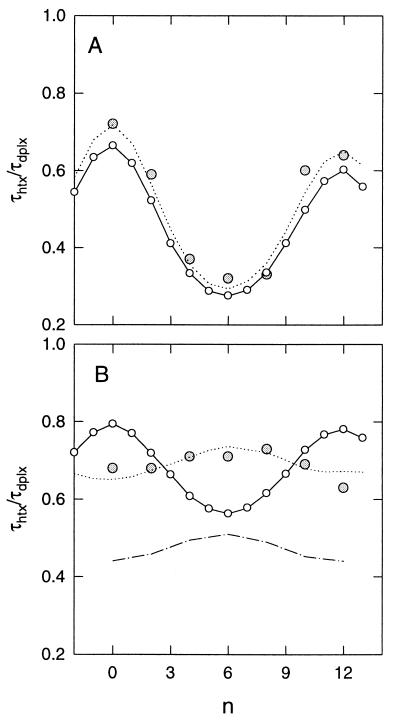
Figure 5.
Phased τ ratio plots for the E[tRNAPhe:A5] species in the presence (A) or absence (B) of magnesium ions. τ ratios, τhtx/τdplx, are plotted as a function of the number (n) of phasing base pairs (see Fig. 2). For experimental τ ratios (shaded circles; diameter ≈ σ for 15 measurements), the reference (duplex) helix length is (182 + n) bp; for computed τ ratios (n = −2 to 13), the bend centers are separated by (21 + n) bp. In both panels, the continuous curves (○) represent τ ratio values computed from the angles in Table 1 and standard helix parameters; they are independent of the experimental data shown, except that both curves are phase-aligned to the experimental curve in A. The absolute bend directions were adjusted to provide phase coherence with the experimental data and should be considered arbitrary. The dashed lines represent global best fits to the experimental data by allowing the angles, Peff, Ceff, and phasing (for B) to vary. In B, dashed lines and dashed and dotted lines represent reductions in Ceff and Peff, respectively, to yield phase amplitudes that are approximately equal to the experimental amplitude.

