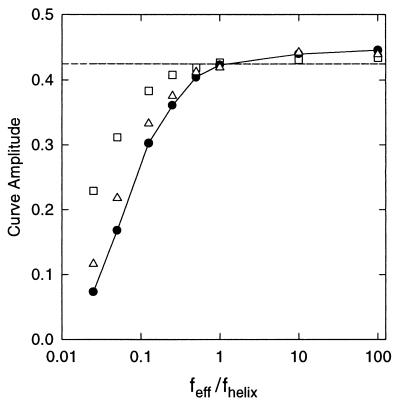
Figure 6.
Dependence of the computed amplitude (≡ τ ration=0 − τ ration=6) of the phased τ ratio curve on the flexibility of the tRNA core, using the optimal experimental amplitude (dashed line) in Fig. 5A. Amplitudes are plotted as a function of feff/fhelix, where f = P (□), C (○), or either P or C (•), for constant P/C (= Phelix/Chelix). For feff/fhelix = 1, the tRNA core possesses no additional bending (P) or torsional (C) flexibility relative to an equivalent length of RNA helix. The horizontal dashed line represents the experimental amplitude for E[tRNAPhe:A5] in 2 mM Mg2+.

