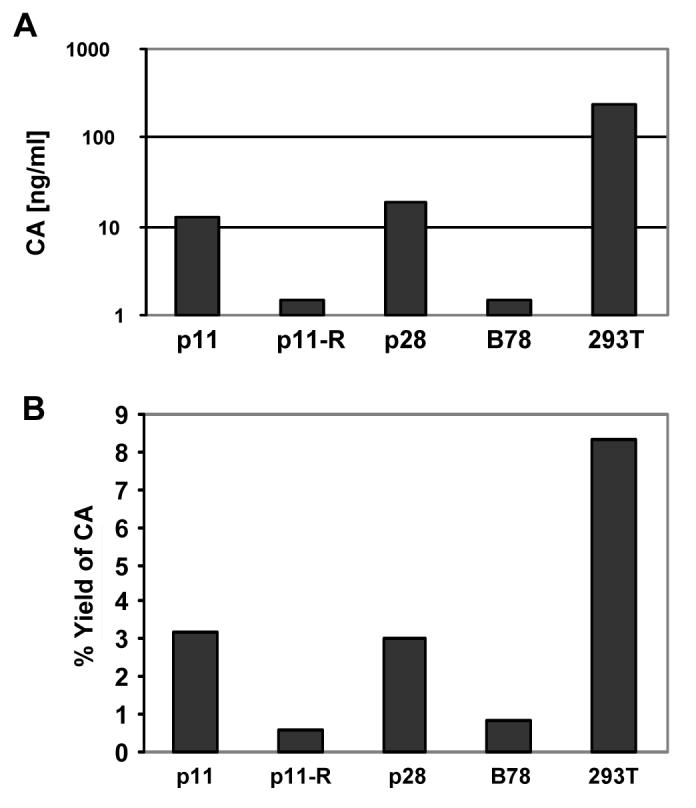
Figure 3. CA analysis of MCHs.

MCHs or 293Ts that had been stably transduced with HIV-CIB or HIV-LIB, respectively, were plated at low density and allowed to reach confluence. At that point equivalent amounts of supernatant and cells were harvested for CA quantitation using commercial ELISA kit. Absolute amounts of supernatant CA are shown in (A). (B) Gag yield (amount of CA in the supernatant divided by amount in cell lysate), using equivalent number of lysed cells. R denotes revertant. This experiment was repeated with similar results.
