
Figure 1. Lzts1 knock-out mice develop spontaneous tumors.
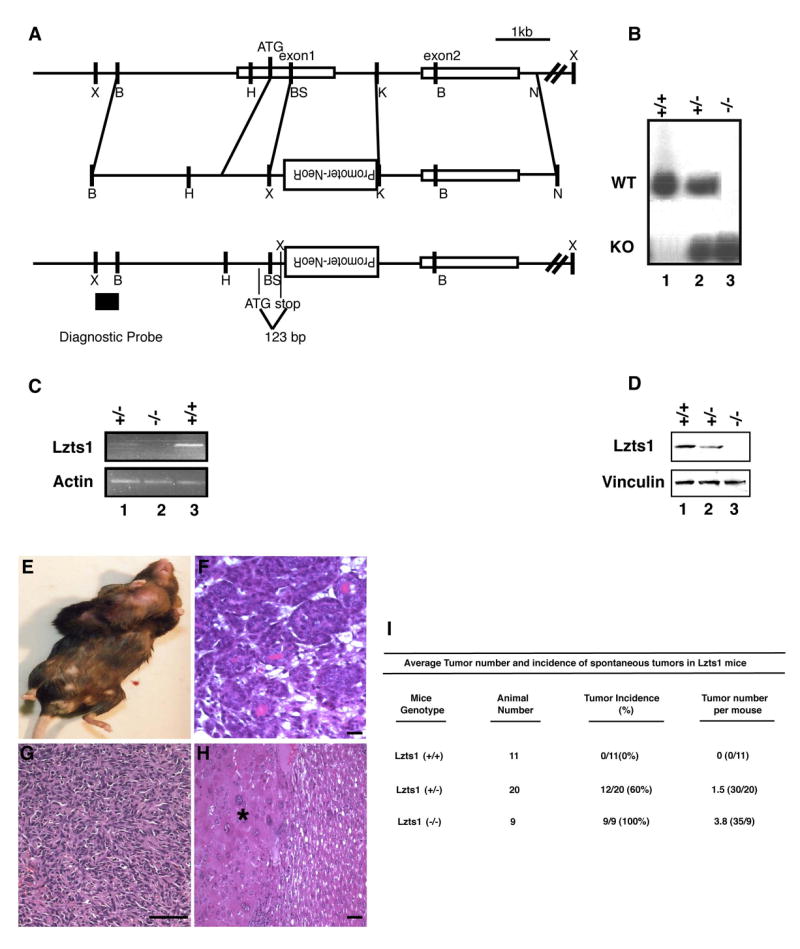
A. Targeting of the mouse Lzts1 locus, showing that the genomic region including exons 1 and 2 of mouse Lzts1 gene (top) were homologously recombinant with targeting vector (middle), which results in the replacement of part of exon 1 with neomycin resistance gene (bottom). Lzts1 coding was stopped at 123 bp down stream of the first Methionine. B, BamHI; K, KpnI; BS, Bsp106; N, NotI; H, HindIII; X, XbaI site. The 600 bp diagnostic probe is located outside of targeting vector sequence. B. Southern blot analysis of mouse genomic DNA, digested with XbaI and probed with the diagnostic probe depicted in panel A. C. RT-PCR analysis showing Lzts1 gene expression in Lzts1+/+, Lzts1+/− and Lzts1−/− MEFs as indicated. Actin mRNA expression was used as loading control. D. Western Blot analysis of Lzts1 expression in brain lysates from Lzts1+/+, Lzts1+/− and Lzts1−/− 15 weeks-old mice. Vinculin expression was used to normalize the amount of loaded proteins in each lane. E. Macroscopic appearance of primary breast tumor in Lzts1 −/− mouse. F. H&E showing ductal differentiation of the breast tumor depicted in E. G. High grade sarcoma of the tight. H. Liver carcinoma is shown (*). Scale bars: 20μm (F and H), 100μm (G). I. Number and incidence of spontaneous tumors in the different genotypes.