
Figure 2. G1/S and S/G2 transitions are not affected by Lzts1 absence in MEFs.
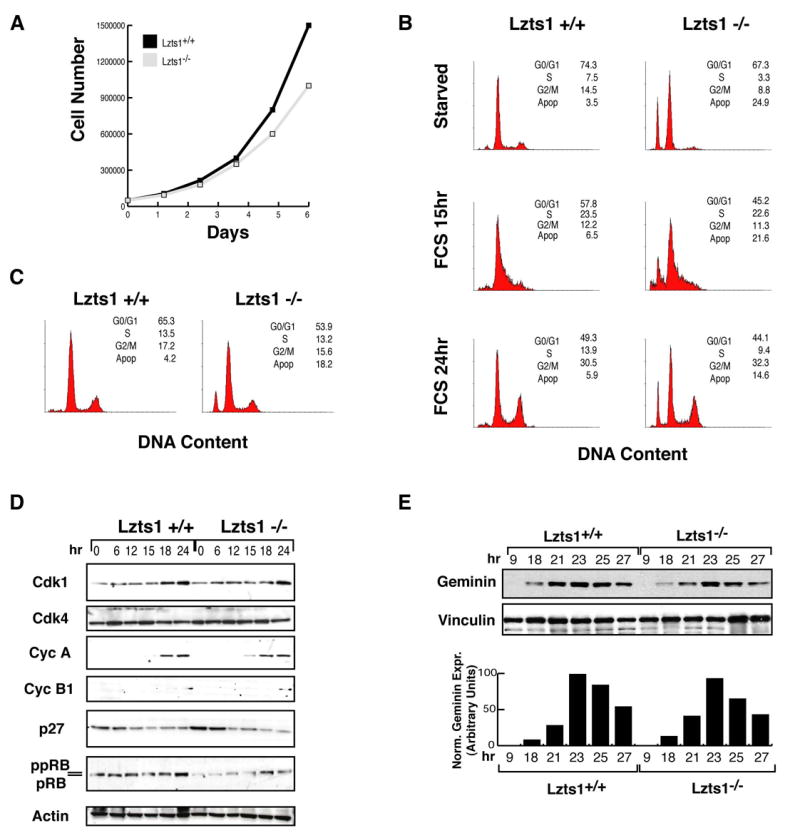
A. Growth curve comparing of Lzts1+/+ (black square) and Lzts1−/− (gray square) cells over 6 days. B. FACS analysis of DNA content of Lzts1+/+ and Lzts1−/− MEFs in logarithmic phase of growth. C. Cell cycle distribution of Lzts1+/+ and Lzts1−/− MEFs serum-starved for 24 hours (starved) and then re-stimulated with 10% FBS containing-medium (FCS) for the indicated time. D. Western blot analysis of cell cycle related proteins in Lzts1+/+ and Lzts1−/− cells treated as in C. E. Western blot analysis of Geminin expression in Lzts1+/+ and Lzts1−/− MEFs serum-starved for 24 hours (starved) and then re-stimulated with 10% FBS containing-medium for the indicated time. In the lower graph the expression of Geminin normalized on the levels of vinculin at each time point is reported.