
Figure 4. Lzts1−/− MEFs displayed a faster M phase progression.
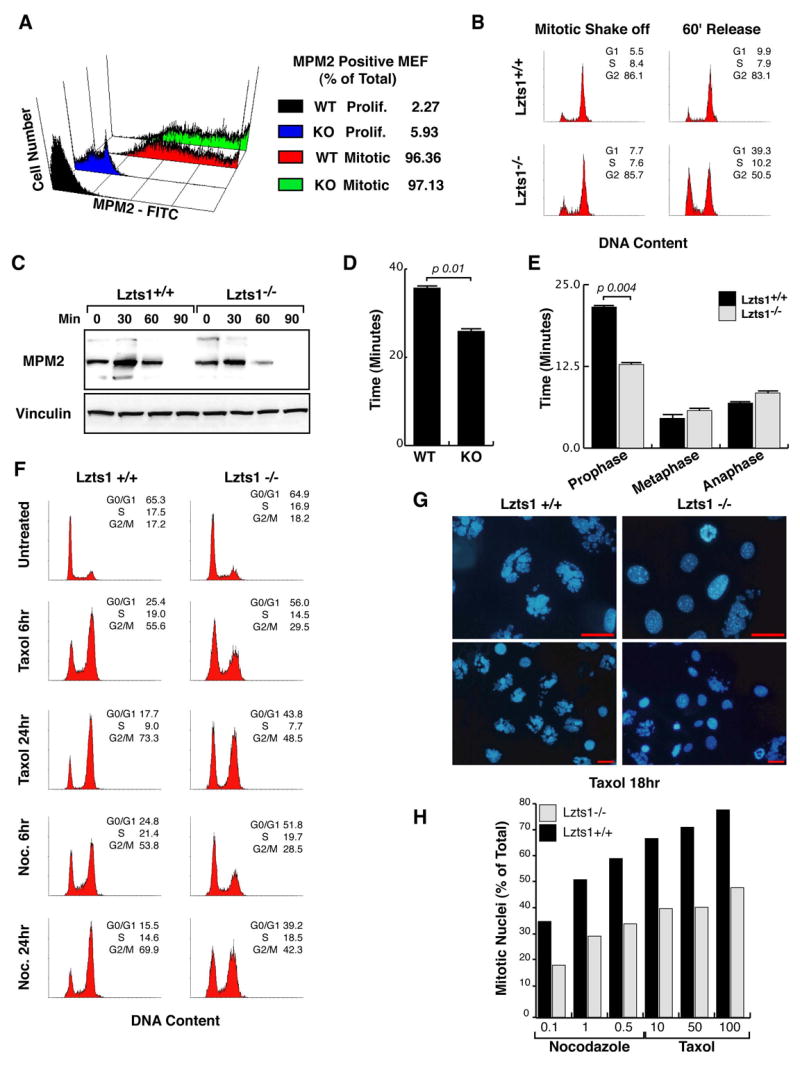
A. Expression of the mitotic phosphoprotein MPM2 in proliferant and mitotic shake-off Lzts1+/+ and −/− MEFs. B. Flow cytometry analysis of Lzts1+/+ and −/− MEFs isolated by mitotic shake off (Left Panels) and released for 60 minutes (Right Panels). C. Expression of the mitotic phosphoprotein MPM2 in cells collected by mitotic shake-off (0) and released for the indicated times. D/E. Quantification of total mitosis length (D) and of time spent in each mitotic phase (E) in Lzts1+/+ and −/− MEFs, evaluated by video time-lapse microscopy. Results (mean ± SD) are representative of eight mitotic cells (n=8) followed independently. F. Flow cytometry analysis of Lzts1+/+ and −/− MEFs treated with 100nM Taxol or 1μM nocodazole, as indicated. G. Hoechst nuclear staining of Lzts1+/+ (left panels) and Lzts1−/− (right panels) MEFs treated for 18 hours with 100nM Taxol. Representative fields are shown. Scale bars 20μm. H. Quantification of mitotic nuclei using the Hoechst nuclear staining in cells treated as indicated. Data represent the mean of 3 independent experiments on two different MEFs populations.