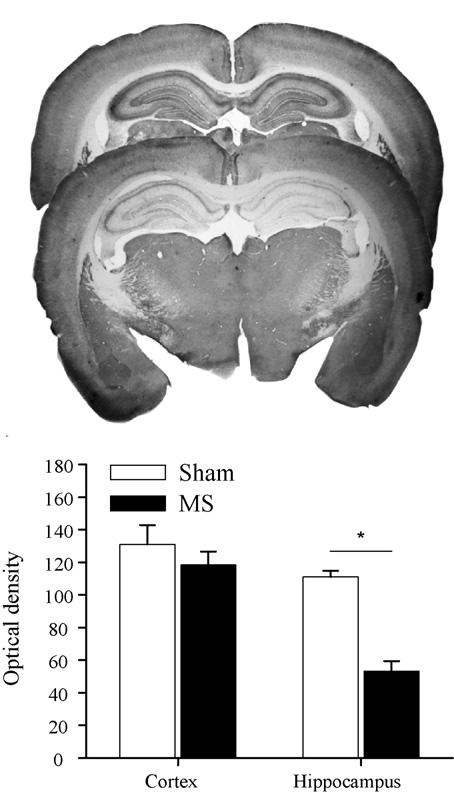
Fig. 1.

Photographs of coronal brain sections stained for acetylcholinesterase at the level of the dorsal hippocampus from representative sham (top panel) and MS (middle panel) rats. Mean hippocampal and cortical optical density values (+S.E.) are plotted for sham and MS rats (bottom panel). Note: Reductions in acetylcholinesterase staining associated with MS lesions are restricted to the hippocampus (p < .05).
