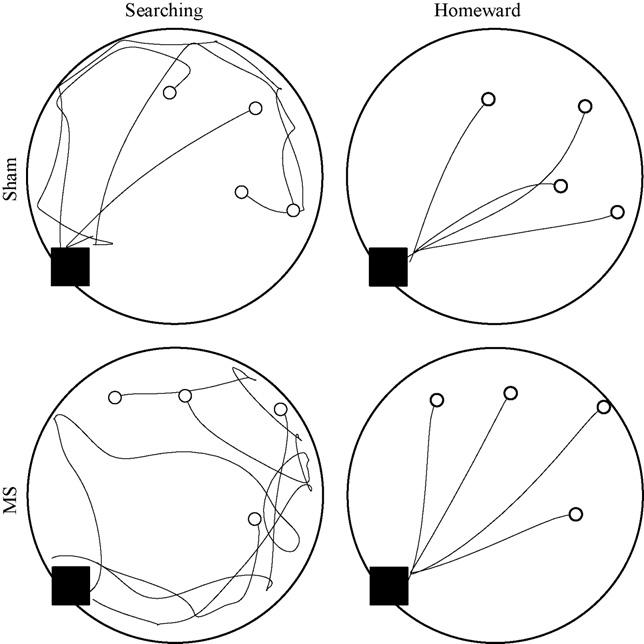
Fig. 2.

Four trips are plotted from representative sham (top panels) and MS (bottom panels) rats during cued testing. Searching and homeward segments are plotted separately in the left and right panels, respectively. The black square indicates the location of the cued refuge and the open circles indicate the locations of the four hazelnuts.
