
Fig. 5.
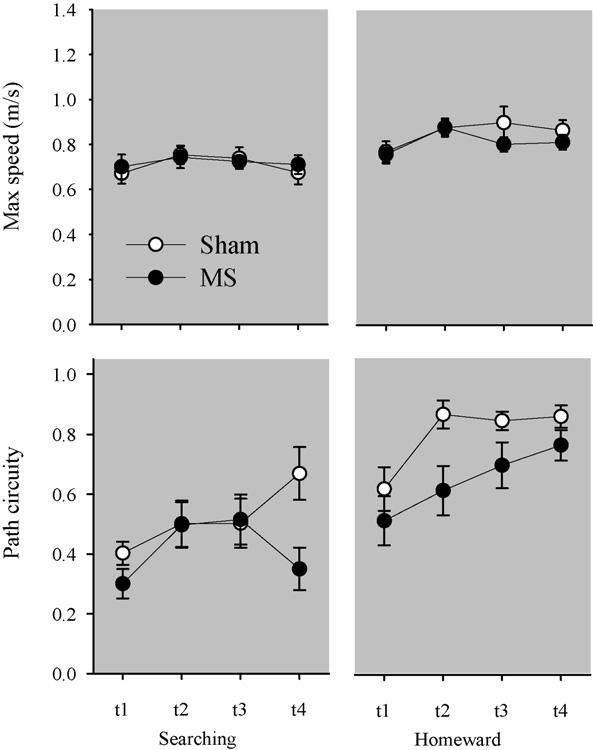
Top panels plot the mean maximum speed (±S.E.) associated with searching (left panel) and homeward (right panel) segments across the four trips during the dark probe. Bottom panels plot the mean path circuity (±S.E.) associated with searching and homeward segments across the four trips during the dark probe.