
Figure 3.
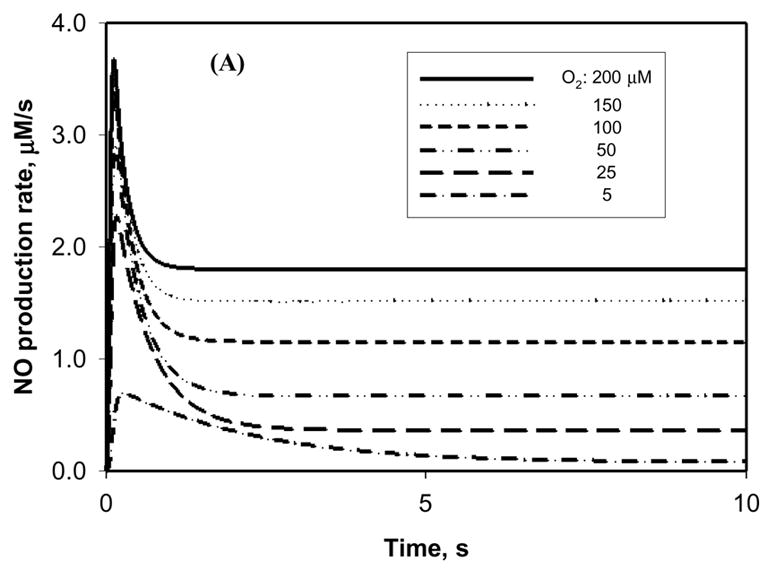
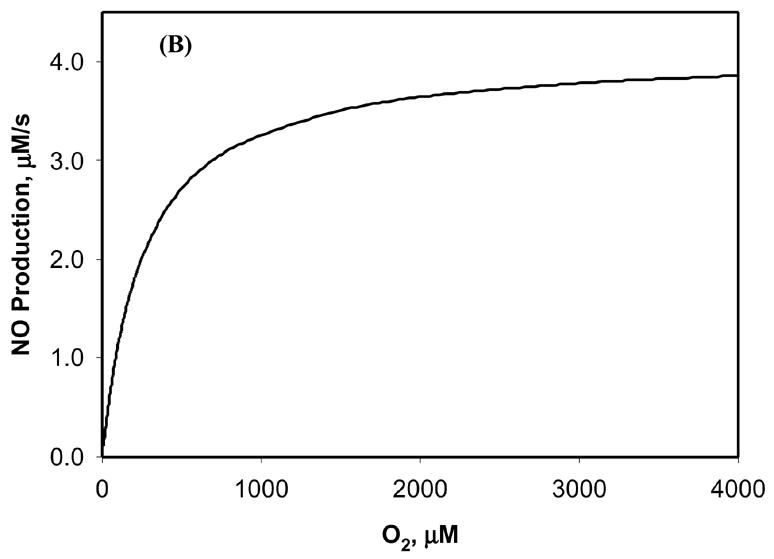
Sensitivity of NO production by NOS to O2 concentration. The concentration of NOS1 was set at 0.9 μM and the concentration of L-arginine was set at 100 μM. (A) The time course of NO production by NOS1 at different ambient O2 concentrations in the physiological range of 5–200 μM. (B) The sensitivity of NO steady-state production by NOS1 to ambient O2 concentrations of up to 4000 μM. The Michaelis constant (Km) of NOS1 for O2 can be estimated from the sensitivity test.