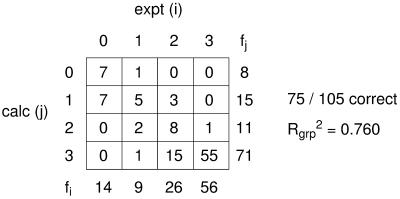
Figure 3.
Correlation table for model III: calculated and experimental dimerization propensities. Binning of the data by experimental (i) and calculated (j) stability enables direct comparison of the scores as integers, where 0 corresponds to no dimerization and 3 corresponds to wild-type dimerization. Model III scores 75 of 105 mutants correctly; the clustering of the data at or near the diagonal is reflected in the Rgrp2 of 0.760 (see Eq. 2).

