
Figure 2.
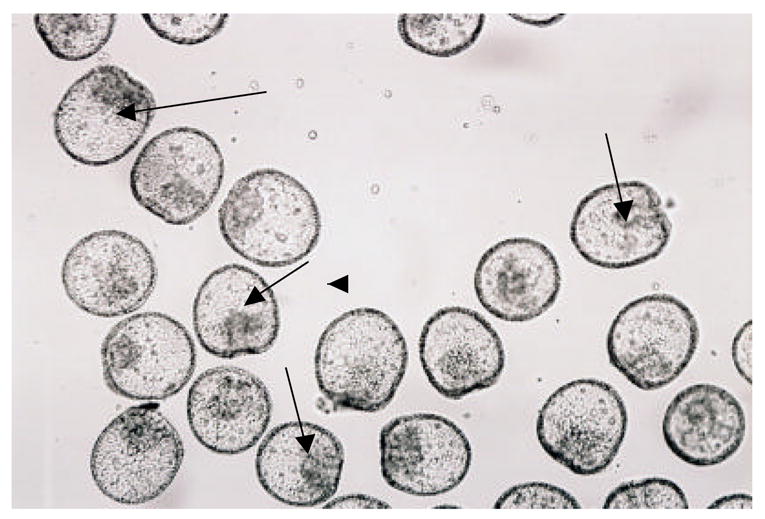
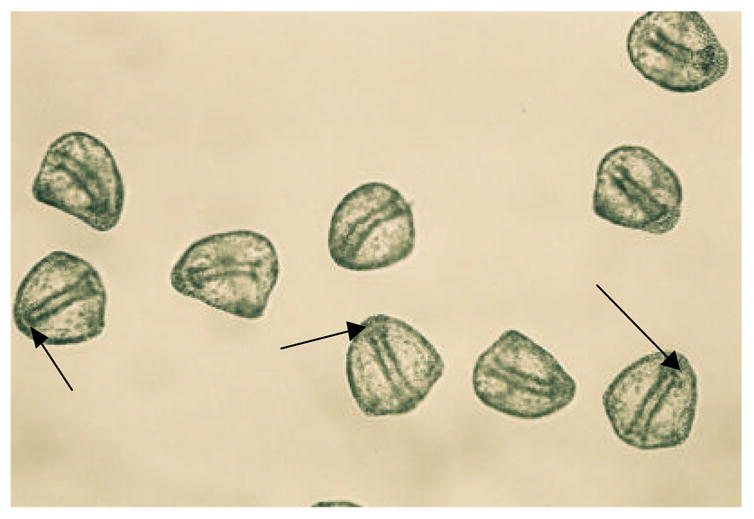
Photos of a-cyclodextrin (0.01 M) treated 48 hr L.pictus embryos (top) and 0.05M glucosamine treated 48 hr L.pictus embryos (bottom). The bottom photo is an example of all other sugar samples at all concentrations tested, and control ASW experiments where embryos were viable that generally appeared identical to the embryos in the bottom photo. Arrows in the top photo show unattached archenterons and in the bottom photo, attached archenterons. Magnification 100X.