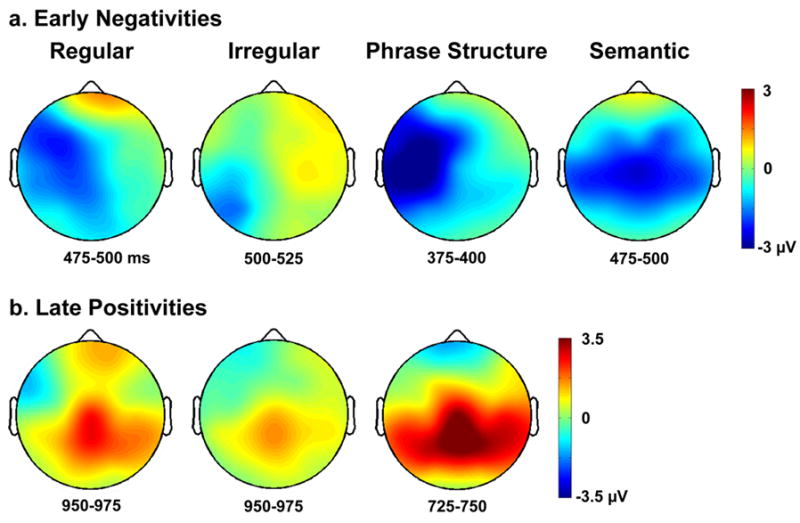
Figure 2.

Scalp topographic maps showing the distribution of the ERP components of interest in the early (a) and late (b) epochs. To capture the peak difference between violation and control words, 50 msec time widows were chosen for each condition centered around the peaks identified on the basis of examination of the waveforms (Figure 1).
