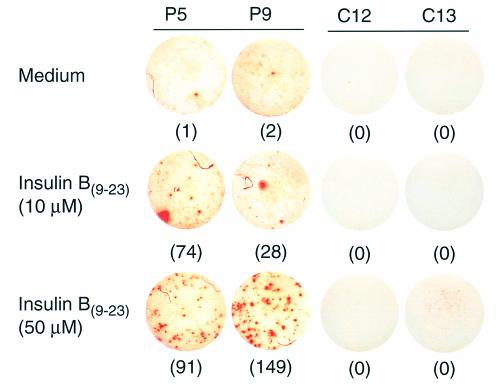
Figure 3.
Example of cytokine responses to insulin B(9–23) by type 1 diabetic patients and control subjects. 3 × 10⁵ freshly isolated PBMCs from two type 1 diabetic patients (P5 and P9) and two age-matched control subjects (C12 and C13) were seeded per well of a 96-well anti–IFN-γ mAb–coated ELISPOT assay plate in the presence or absence of insulin B(9–23) and incubated at 37°C for 24 hours. Spots representing IFN-γ–producing cells (denoted by the number in parentheses) were developed using a biotinylated anti–IFN-γ secondary antibody and avidin-labeled peroxidase with AEC substrate and quantified using the Series-1 Immunospot Analyzer.

