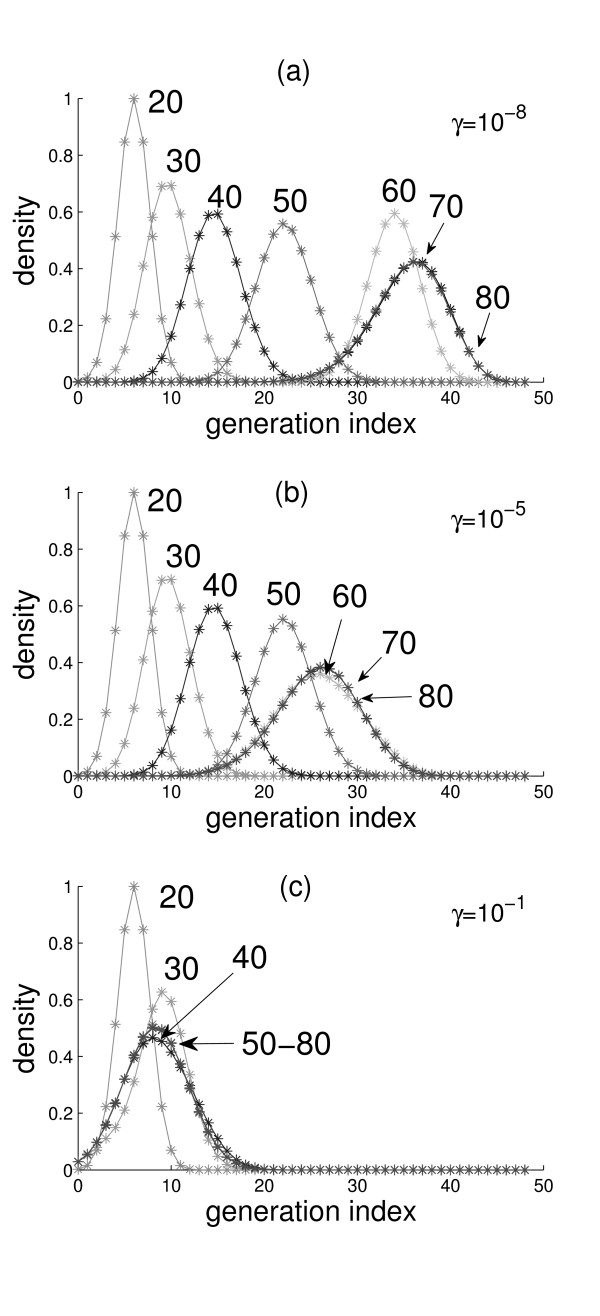
Figure 2.
Cell generation profiles. Cell generation profiles for a person with advancing chronological age of T = 20, 30, 40, 50, 60, 70, and 80 years (numbers near the peaks of the curves). The three values used in the simulations for the progenitor cell homing parameter γ are indicated; values of all other parameters are in Table 1.

