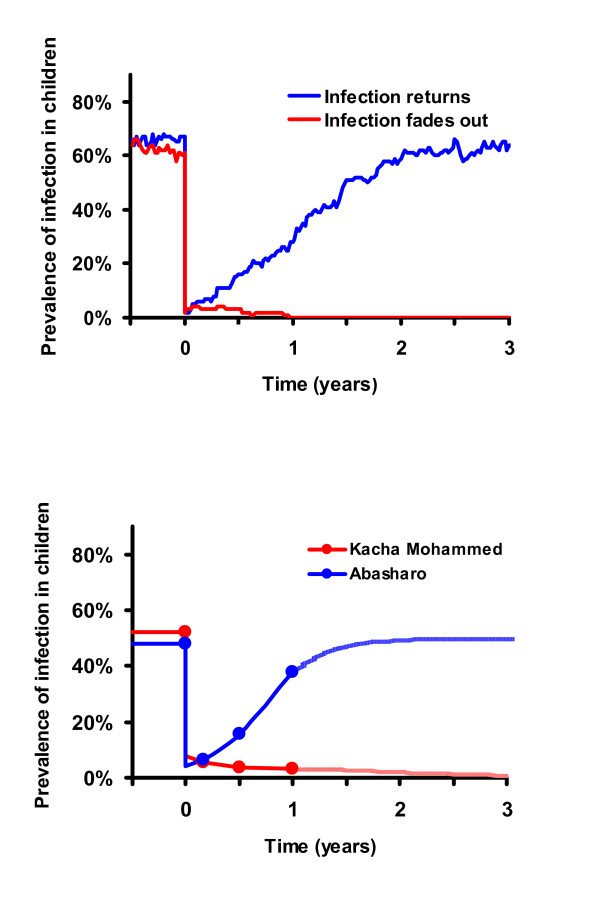
Figure 2.
a. Simulation data after one treatment: In identical simulated communities, infection responds to identical treatment in different ways. It may return after a single mass antibiotic treatment relatively rapidly (blue curve) or fade out (red curve) due to the effects of chance. b. Real Ethiopian villages after one treatment: In Ethiopian communities with similar pre-treatment prevalence of infection and similar antibiotic coverage levels, infection may return relatively rapidly (blue curve), or fade out (red curve).

