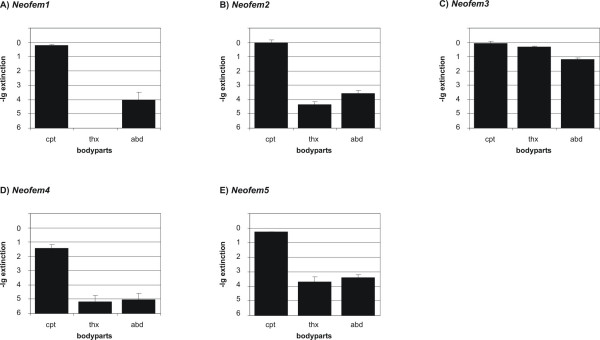
Figure 5.
Quantification of Neofem genes in different body parts. Relative expression levels of Neofem 1–5 genes (A -E) for different body parts measured by qRT-PCR. The Y-axis is on negative log10 scale indicating the gene expression levels and the calculated errors (SD). cpt: caput, thx: thorax and abd: abdomen.

