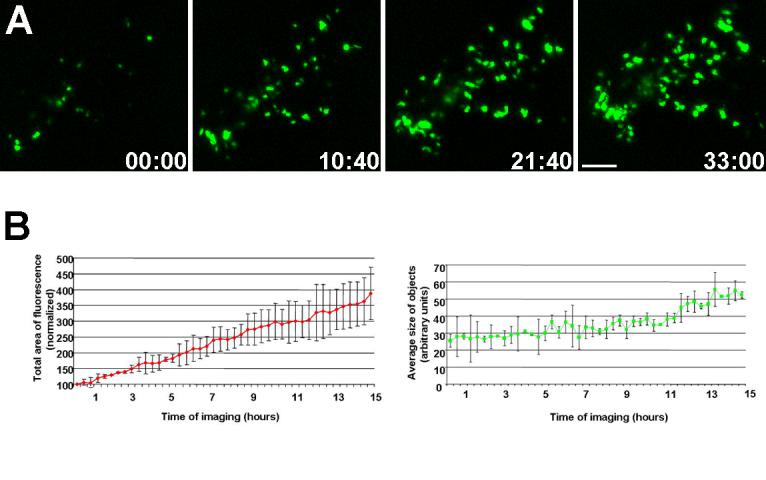
Figure 6. Real-time imaging of ß-cells during embryonic pancreatic development.

A. Still frames from a time lapse movie depict the increase in the total fluorescence in the field, indicating an increase in ß-cells over time. Time of imaging is shown in hours:minutes. Bar, 100μm. B. Quantification of the fluorescent objects show an increase in the total area of fluorescence and the average size of objects (n=3).
