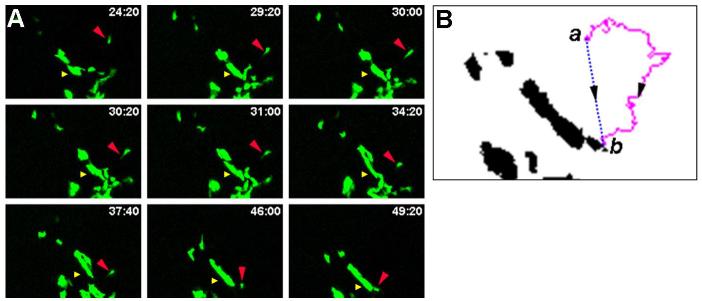
Figure 7. Migration of ß-cells towards clusters of cells.
A. Stills from a time-lapse series show migration of a ß-cell towards a larger cluster of cells. The distance between the single cell (red arrowhead) and the cluster of cells (yellow arrowhead) changed from 88.5μm to 49.9μm during imaging. Time of imaging is shown in hours:minutes. B. Migration of a single ß-cell occurred over 365μm (a to b, magenta line) at an average velocity of 11.4μm/hr.

