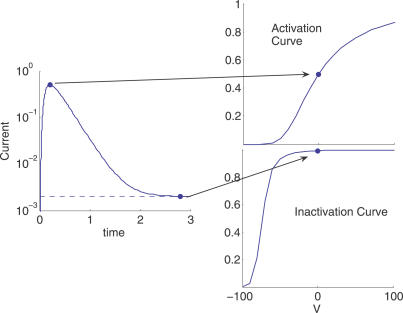
Figure 1. Experimental Characterization of Sodium Channels Used in This Paper.
A step change in the membrane potential from a very negative value (for t < 0) where all the channels are closed, to V (at t = 0) results in a measurable current. The left panel shows the current for V = 0 mV. The activation curve (upper right) is constructed by plotting the maximum current as a function of V, normalized by the maximum current as V → ∞. The inactivation curve (lower right) is the steady state current as a function of V, also normalized by the steady state value as V → ∞. This figure was produced using Kuo and Bean's model for sodium channels [56].

